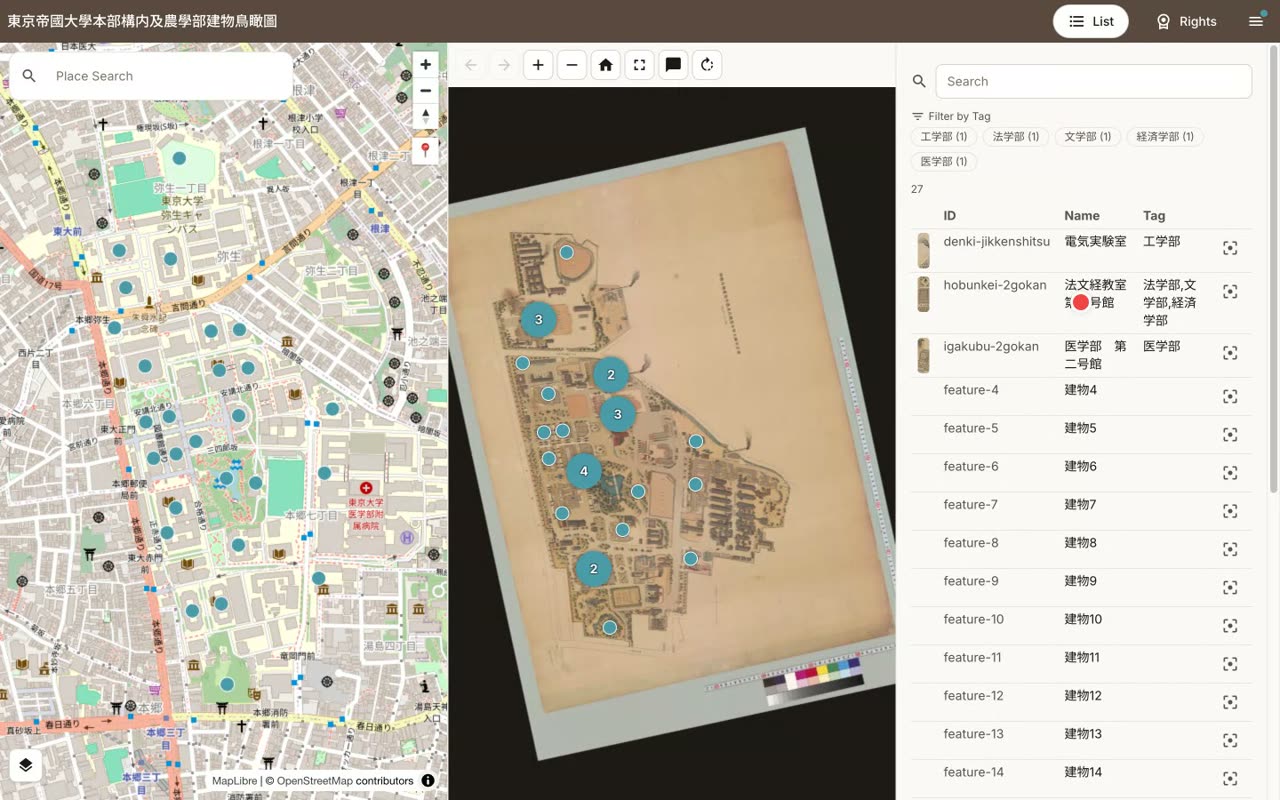
How to use the IIIF Georeference Viewer
A video walkthrough of the browser viewer that overlays historical maps and images onto modern maps via the IIIF Georeference Extension.
Narrated walkthrough
Chapters
- 1
Introduction & landing
Overview of IIIF and the Georeference Extension, and picking a sample
Narration script
- 0:03IIIF Georeference Viewer
IIIF Georeference Viewer is an open-source, browser-based viewer that overlays historical maps and images precisely onto a modern map. It supports the IIIF Georeference Extension.

- 0:20Enter a Canvas URL, or pick a sample
Getting started is simple. On the top page, enter the URL of a Canvas, or choose one of the three built-in samples. In this video, we'll walk through the features on the live screen.
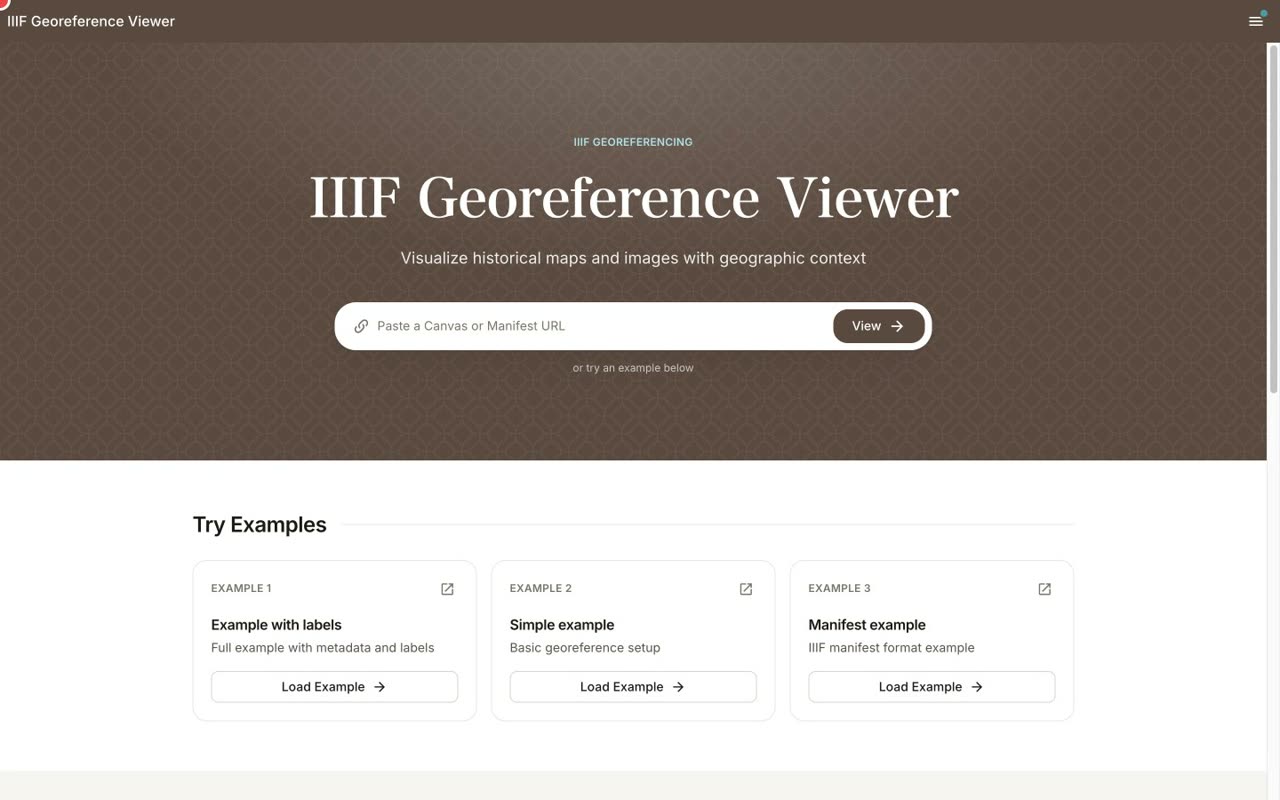
- 0:36Key features: IIIF image / georeference / overlay
The key features are high-resolution IIIF image viewing, georeferencing that places an image accurately on a map, and overlay display that combines multiple layers.

- 2
Loading data
Entering a Canvas / Manifest URL and auto-detection
Narration script
- 0:05Load the sample 'Example with labels'
First, let's load some data. This time we'll choose the sample called Example with labels. Clicking the card fills the URL into the input field.

- 0:23Submit to open the viewer (Canvas / Manifest auto-detected)
Submitting switches to the viewer. The input can be either a Canvas or a Manifest; the viewer automatically detects which one it is.

- 0:38Supports Presentation API 3.0 Manifests
If a Presentation API 3.0 Manifest contains georeference annotations, multiple Canvases can be loaded directly as well.

- 3
Viewer layout
Left: modern map / Right: historical image / feature markers
Narration script
- 0:05Left: modern map Right: historical image
The viewer is split in two. A modern map on the left, and the historical image on the right. This example is a bird's-eye map of the Hongo campus of the former Tokyo Imperial University.
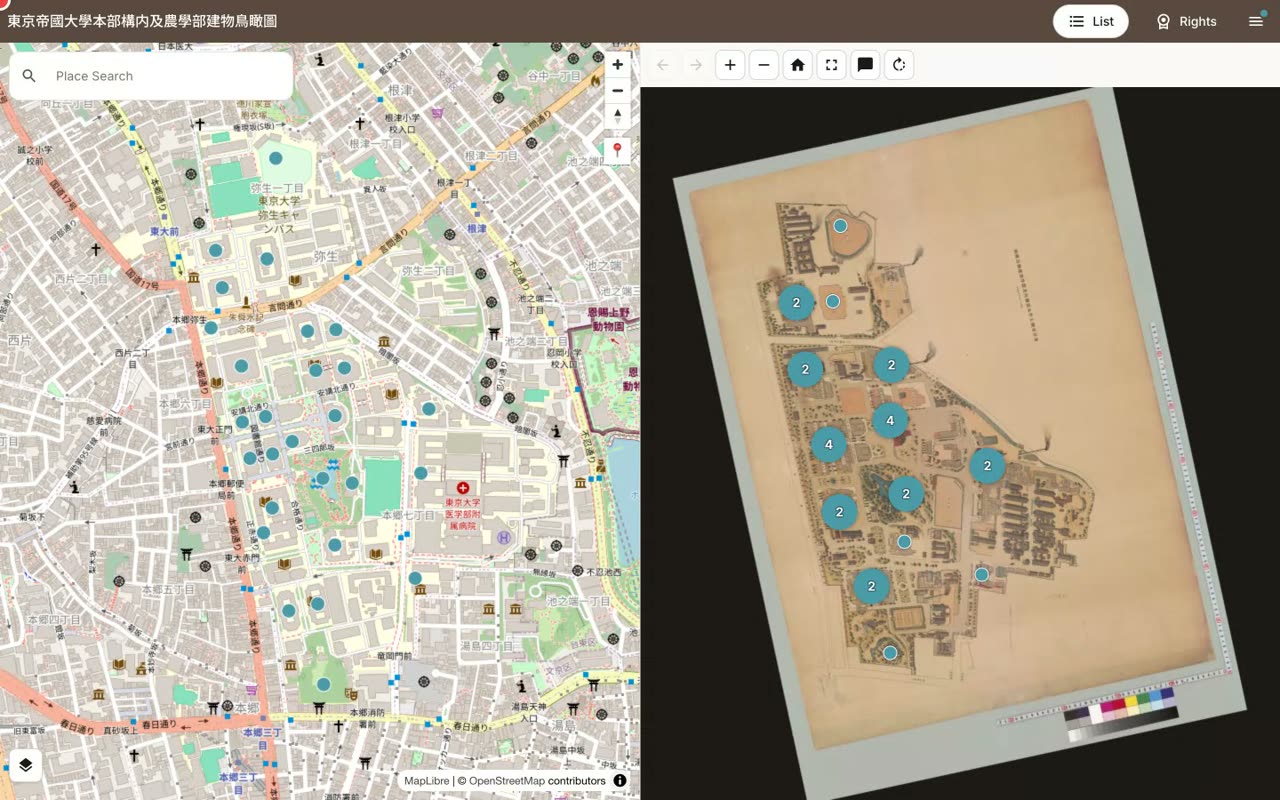
- 0:22Feature markers correspond across map and image
The numbered blue markers shown in both panes indicate features such as buildings. They are placed at the same locations across the map and the image.

- 0:38The old campus aligns with today's streets
Thanks to georeferencing, the layout of the old campus and today's streets are displayed precisely on top of each other.

- 4
Syncing features
Click a row in the list panel to sync focus across the map and image
Narration script
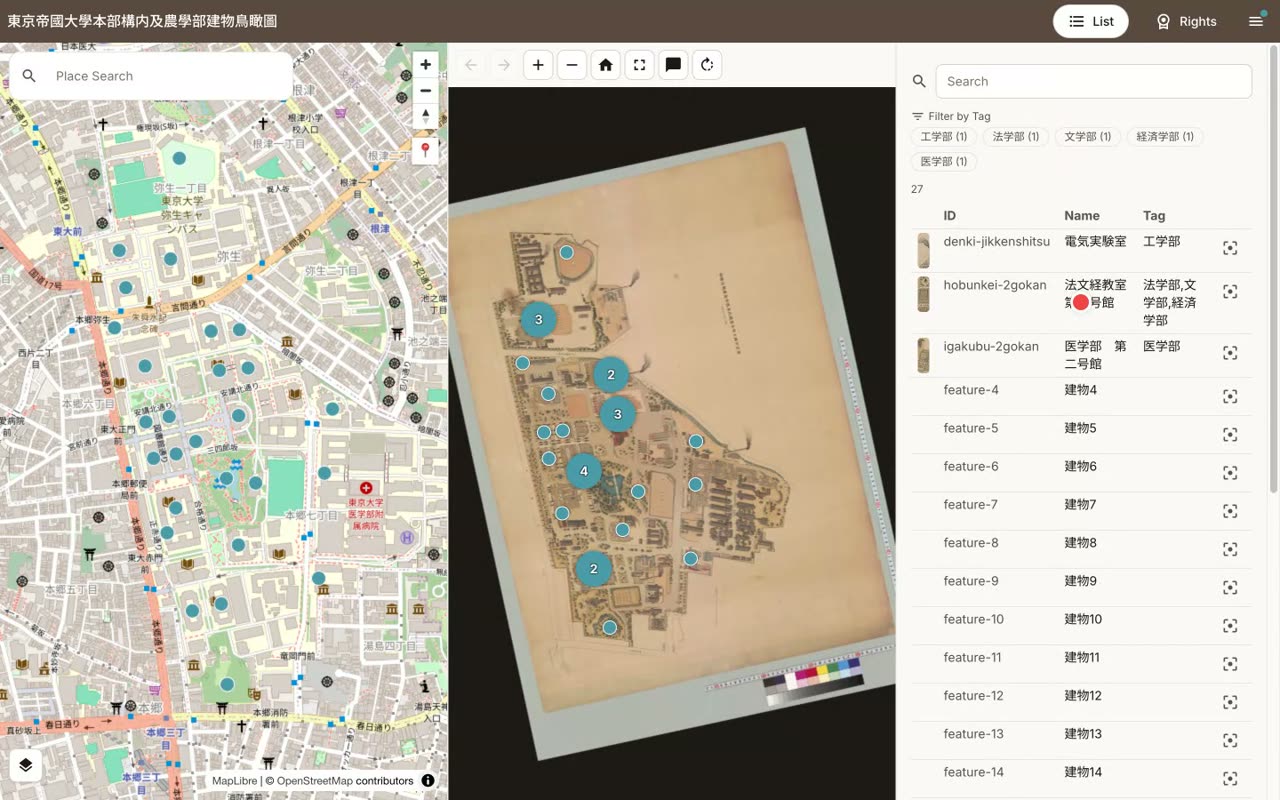
- 0:07Open the feature list with 'List'
Pressing the List button at the top right opens a list of features. Each feature is listed by name, such as the Electrical Laboratory or the Second Building of the Faculty of Medicine.

- 0:27Click a feature to sync the views
When you click a feature in the list, both the image and the map focus on that feature and stay in sync. You can tell at a glance where you are looking.

- 0:44Zoom in and still locate the spot
Even when you zoom into the image, the corresponding location on the map is immediately clear.

- 0:57Home returns to the full view
Pressing the home button returns to the full view of the image at any time.

- 5
Image & map controls
Image rotation, toggling annotations, switching base maps
Narration script
- 0:08'Angle' rotates the image
Angle lets you adjust the rotation of the image. Moving the slider aligns the historical image with the orientation of the modern map. Auto-rotate and reset are also available.

- 0:26'Annotations' toggles the feature markers
Annotations lets you show or hide the feature markers, and toggle clustering. This is handy when there are many markers.

- 0:43Switch base map: OSM / GSI / aerial / Rekichizu
You can switch the map layer between OpenStreetMap, the Geospatial Information Authority of Japan, aerial photos, and Rekichizu. With aerial photos, you can compare today's buildings against the old layout.

- 6
Applications & wrap-up
URL sharing and Linked Places Format–compatible metadata
Narration script
- 0:05View state is shareable via the URL
Your current view state is automatically reflected in the URL. The map position, zoom, and even the image's rotation angle can be shared with others through a single link.

- 0:26Linked Places Format–compatible metadata
Features can carry Linked Places Format–compatible details and external links, ready to use directly in research and digital archives.
- 0:41Open source on GitHub / try it with your own data
The source code is available on GitHub. Just enter the URL of your own Canvas or Manifest to overlay your own historical maps right away. See the links in the description for details.