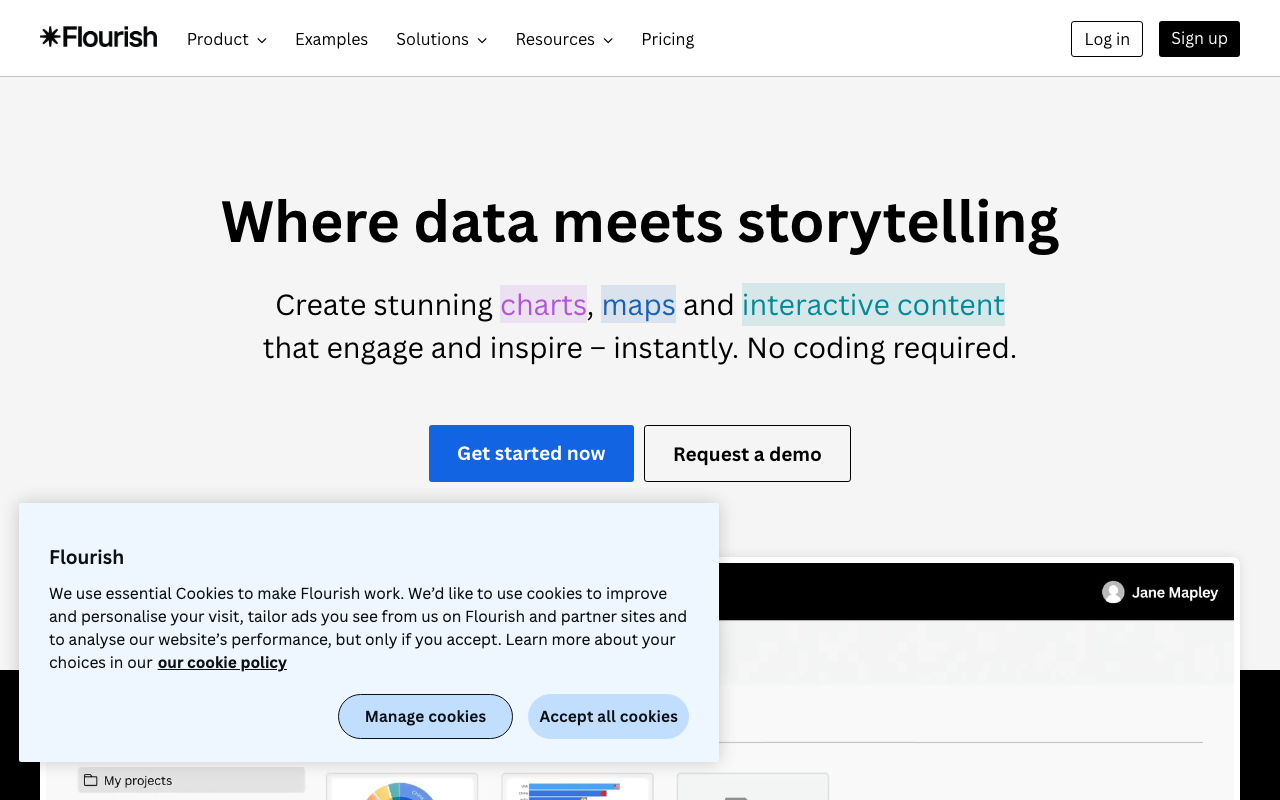
Flourish: An Interactive Data Storytelling Platform
Introduction Data visualization is a powerful means of communicating information. However, static charts alone sometimes struggle to effectively convey temporal changes or complex stories. Flourish is a platform that enables data storytelling through animation and interaction. It makes it easy to create dynamic visualizations such as race charts (bar chart races) and animated maps. It is used by organizations including BBC, Google, and the World Bank, and offers a free plan. ...