This article summarizes the procedure for generating XYZ tiles from IIIF Georeference Extension JSON, serving them with TileServer GL, and displaying them with MapLibre GL JS.
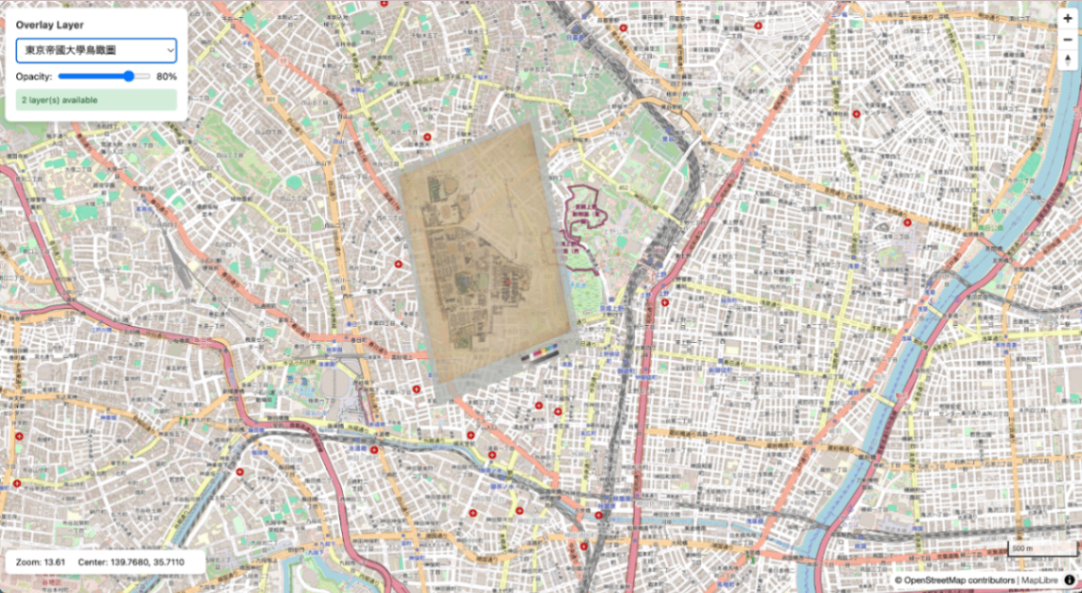
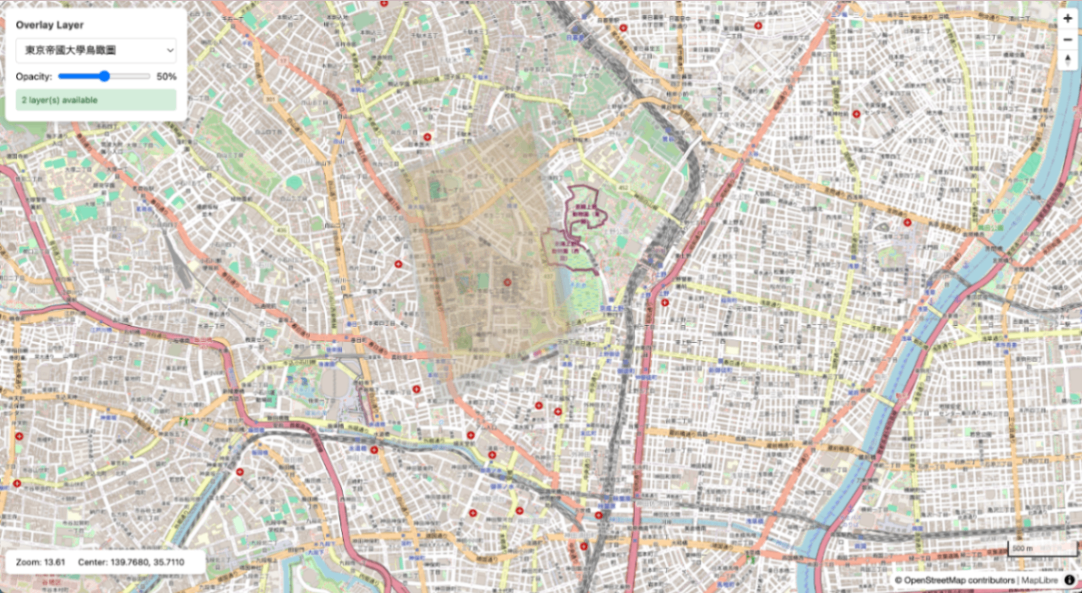
Aerial view of the University of Tokyo overlaid on OSM
Overview
IIIF Georeference JSON
        |
        v
+------------------------+
| iiif-georef-tiles      |
| (XYZ tile generation)  |
+------------------------+
        |
        v
+------------------------+
| mb-util                |
| (mbtiles conversion)   |
+------------------------+
        |
        v
+------------------------+
| TileServer GL          |
| (tile serving)         |
+------------------------+
        |
        v
+------------------------+
| MapLibre GL JS         |
| (map display)          |
+------------------------+
Requirements
- Docker / Docker Compose
- Python 3.x
- GDAL (
gdal_translate,gdalwarp,gdal2tiles.py) - Pillow (
pip3 install pillow) - mb-util
Installing GDAL
# macOS (Homebrew)
brew install gdal

# Ubuntu/Debian
sudo apt install gdal-bin python3-gdal
Installing mb-util
pip3 install mbutil
1. Project Structure
wtms/
├── docker-compose.yml
├── data/                 # mbtiles files
├── styles/               # Custom styles (optional)
├── frontend/             # MapLibre viewer
└── docs/
2. Docker Compose Configuration
docker-compose.yml:
services:
  tileserver:
    image: maptiler/tileserver-gl:latest
    container_name: wtms-tileserver
    ports:
      - "8888:8080"
    volumes:
      - ./data:/data
      - ./styles:/styles
    restart: unless-stopped

  frontend:
    image: nginx:alpine
    container_name: wtms-frontend
    ports:
      - "8889:80"
    volumes:
      - ./frontend:/usr/share/nginx/html:ro
    restart: unless-stopped
3. Generating XYZ Tiles from IIIF Images
Use iiif-georef-tiles.
Both Canvas format and Manifest format are supported.
# Clone the repository
git clone https://github.com/nakamura196/iiif-georef-tiles.git
cd iiif-georef-tiles

# Generate XYZ tiles (specify a Canvas or Manifest format URL)
python3 scripts/iiif_georef_to_tiles.py IIIF_GEOREF_URL> --output-dir ../tiles_output
Example: Aerial View of the University of Tokyo
python3 scripts/iiif_georef_to_tiles.py https://nakamura196.github.io/iiif_geo/canvas.json --output-dir ../tiles_output
Both Canvas format and Manifest format are accepted as input. For Manifest format, the first Canvas is automatically extracted.
Processing flow:
- Fetch IIIF Georeference JSON (automatically extract Canvas for Manifest format)
- Download image from IIIF Image API (fetch maximum size with
full/max) - Embed all GCPs (gdal_translate)
- Coordinate transformation (gdalwarp, polynomial degree obtained from JSON)
- Generate XYZ tiles (gdal2tiles.py)
4. Converting XYZ Tiles to mbtiles
Convert XYZ tiles to mbtiles format for serving with TileServer GL.
Important: Specify the --scheme=xyz option. Without it, the Y coordinate will be flipped and tiles will be displayed in the southern hemisphere.
python3 -c "from mbutil import disk_to_mbtiles; disk_to_mbtiles('tiles_output/tiles', 'data/tokyo_utokyo.mbtiles', image_format='png', scheme='xyz')"
Adding Metadata
The mbtiles generated by mb-util does not contain metadata, so add it manually:
sqlite3 data/tokyo_utokyo.mbtiles <<'EOF'
INSERT INTO metadata (name, value) VALUES ('name', 'Aerial View of Tokyo Imperial University');
INSERT INTO metadata (name, value) VALUES ('format', 'png');
EOF
Note: Do not add metadata such as scheme=xyz. mbutil internally stores Y coordinates in TMS format, and TileServer GL recognizes them as TMS format by default. Adding scheme=xyz will skip the coordinate conversion and tiles will not display correctly.
5. Starting TileServer GL
docker compose up -d
Verification
- TileServer GL: http://localhost:8888/
- TileJSON: http://localhost:8888/data/tokyo_utokyo.json
- Data list: http://localhost:8888/data.json
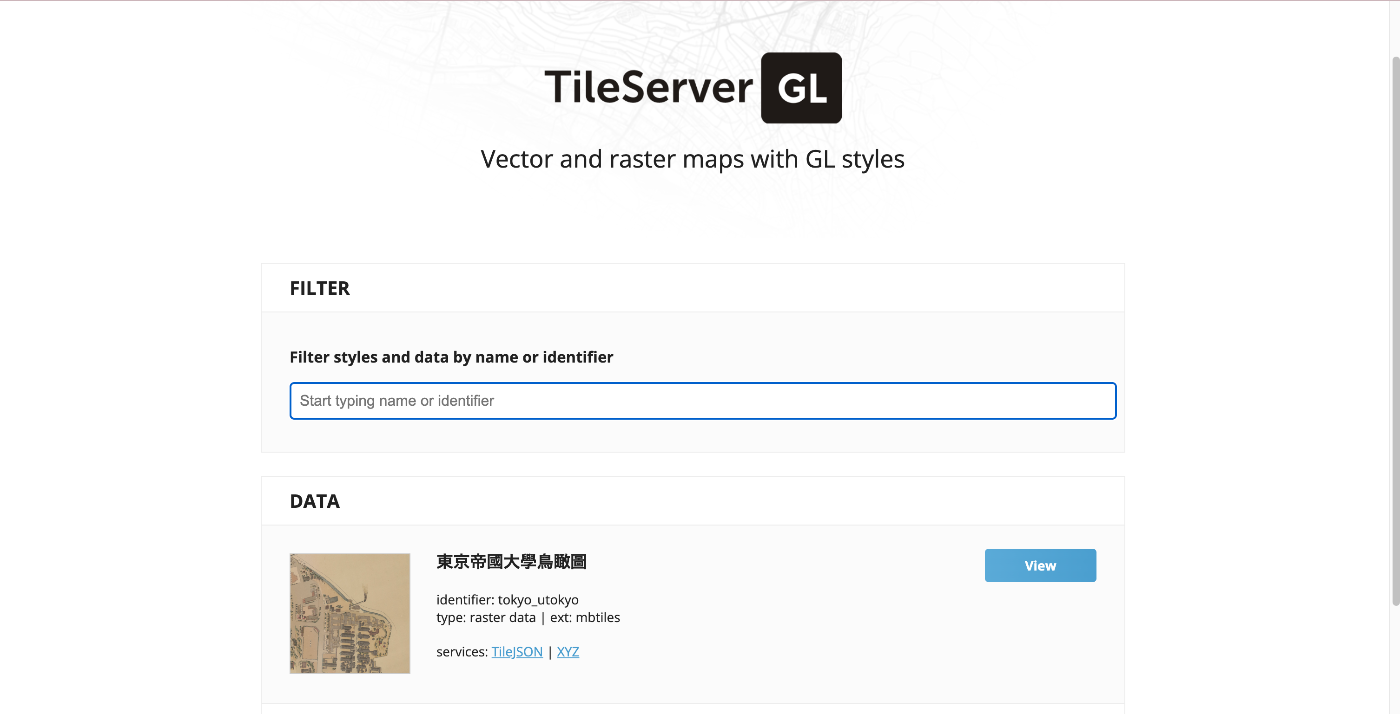
TileServer GL top page
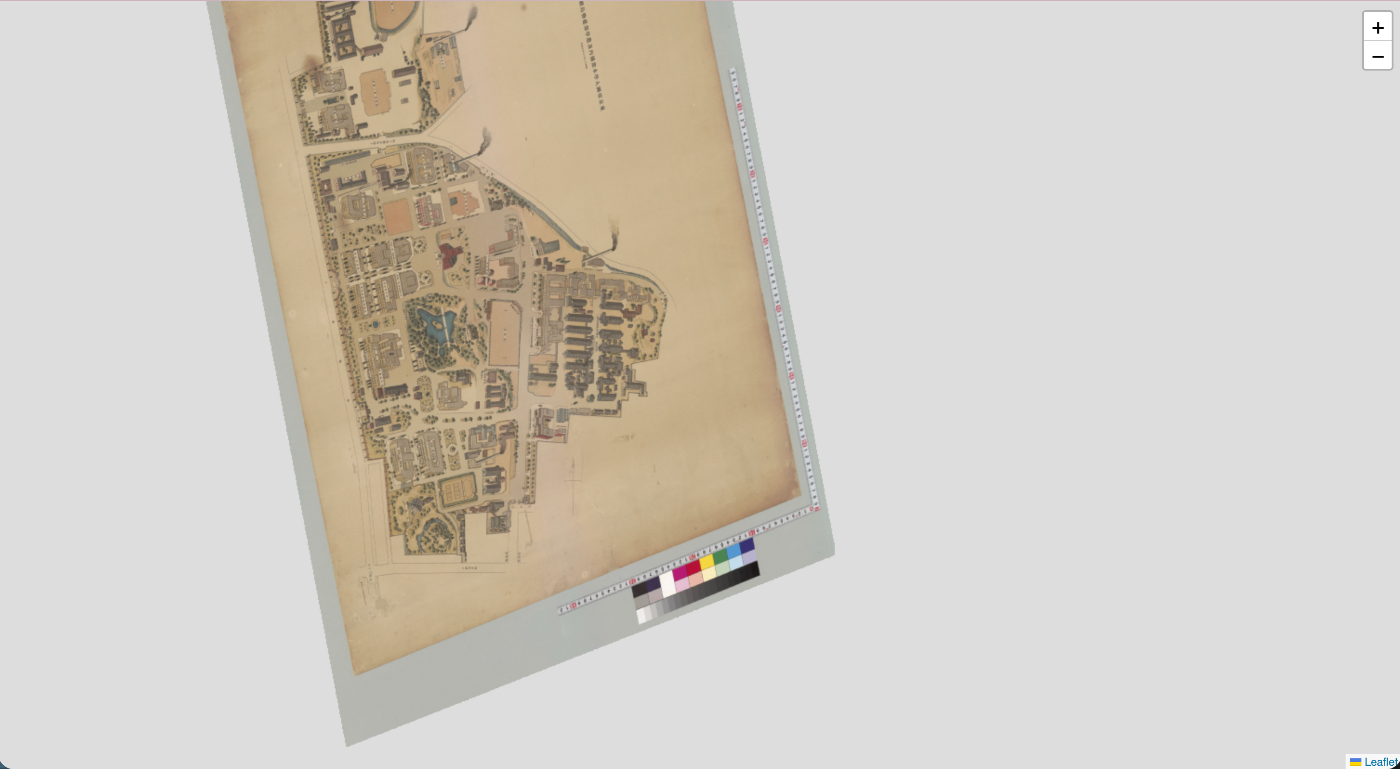
Data detail page (TileJSON information)
6. Displaying with MapLibre GL JS
Fetch tiles from TileServer GL and display them with MapLibre.
const TILESERVER_URL = 'http://localhost:8888';

// OSM base map
const map = new maplibregl.Map({
    container: 'map',
    style: {
        version: 8,
        sources: {
            'osm': {
                type: 'raster',
                tiles: ['https://tile.openstreetmap.org/{z}/{x}/{y}.png'],
                tileSize: 256
            }
        },
        layers: [{
            id: 'osm-layer',
            type: 'raster',
            source: 'osm'
        }]
    },
    center: [139.768, 35.711],
    zoom: 16
});

// Add overlay from TileServer
map.on('load', () => {
    map.addSource('overlay', {
        type: 'raster',
        url: `${TILESERVER_URL}/data/tokyo_utokyo.json`
    });

    map.addLayer({
        id: 'overlay-layer',
        type: 'raster',
        source: 'overlay',
        paint: {
            'raster-opacity': 0.8
        }
    });
});
Adjusting Opacity
Adjusting opacity with a slider makes it easy to compare with the base map.
| Opacity 100% | Opacity 50% |
|---|---|
 |  |
Basic Commands
# Start
docker compose up -d

# Stop
docker compose down

# Check logs
docker compose logs -f tileserver

# Restart (after adding mbtiles files)
docker compose restart tileserver
Endpoints
| URL | Description |
|---|---|
| http://localhost:8888/ | TileServer GL top page |
| http://localhost:8888/data.json | Data source list |
| http://localhost:8888/data/{name}.json | TileJSON |
| http://localhost:8888/data/{name}/{z}/{x}/{y}.png | Tile retrieval |
| http://localhost:8889/ | MapLibre viewer |